What a Good AI Visibility Score Looks Like
Everyone asks the same question second. First comes “what is my AI visibility score?” Immediately after: “is that good?”
It is a fair question and it deserves a straight answer, which is that there is no good score in the abstract, and the sector benchmark tables circulating as though there were are largely invented. That sounds like a dodge. It is not. There are three comparisons that genuinely tell you whether your number is healthy, and none of them is a published industry average.
In this article:
The honest answer
A good AI visibility score is one that is higher than your own last measurement and higher than the competitors inside your own prompt set. There is no universal threshold, because the score depends entirely on which prompts were asked, on which engines, and whether your category is being asked about at all.
Two firms can both score 20% and be in completely different positions. One is appearing in 8 of 40 high-intent prompts in a crowded category where every answer names three competitors. The other is appearing in 8 of 40 prompts almost nobody asks, because its category barely features in AI answers yet. Same figure. The strategic reality is not remotely comparable.
Why sector benchmarks are mostly fiction
You will find tables claiming the average AI visibility score for law firms is 18%, or that SaaS companies average 31%. Treat them with suspicion, for three reasons.
There is no shared denominator. An AI visibility score is appearances divided by prompts run. Since every provider uses a different prompt set, a different number of engines and a different number of runs, no two scores are measuring against the same base. Averaging them produces a number with no unit. We set out how much the method changes the output in what an AI Visibility Score is.
The sample is nobody’s category. “Law firms” spans a sole practitioner doing conveyancing in Leeds and a City firm doing cross-border M&A. They share a SIC code and nothing else about how buyers search for them. An average across both describes neither.
It ages in weeks. Engine behaviour, citation habits and the volume of AI queries in any given category are all moving quickly. A benchmark gathered six months ago is describing a different search environment.
The one benchmark worth having is the one you build yourself, from your own prompt set, including your actual competitors. It takes a day and it is the only comparison that holds.
The three comparisons that mean something
1. Against your own prior period
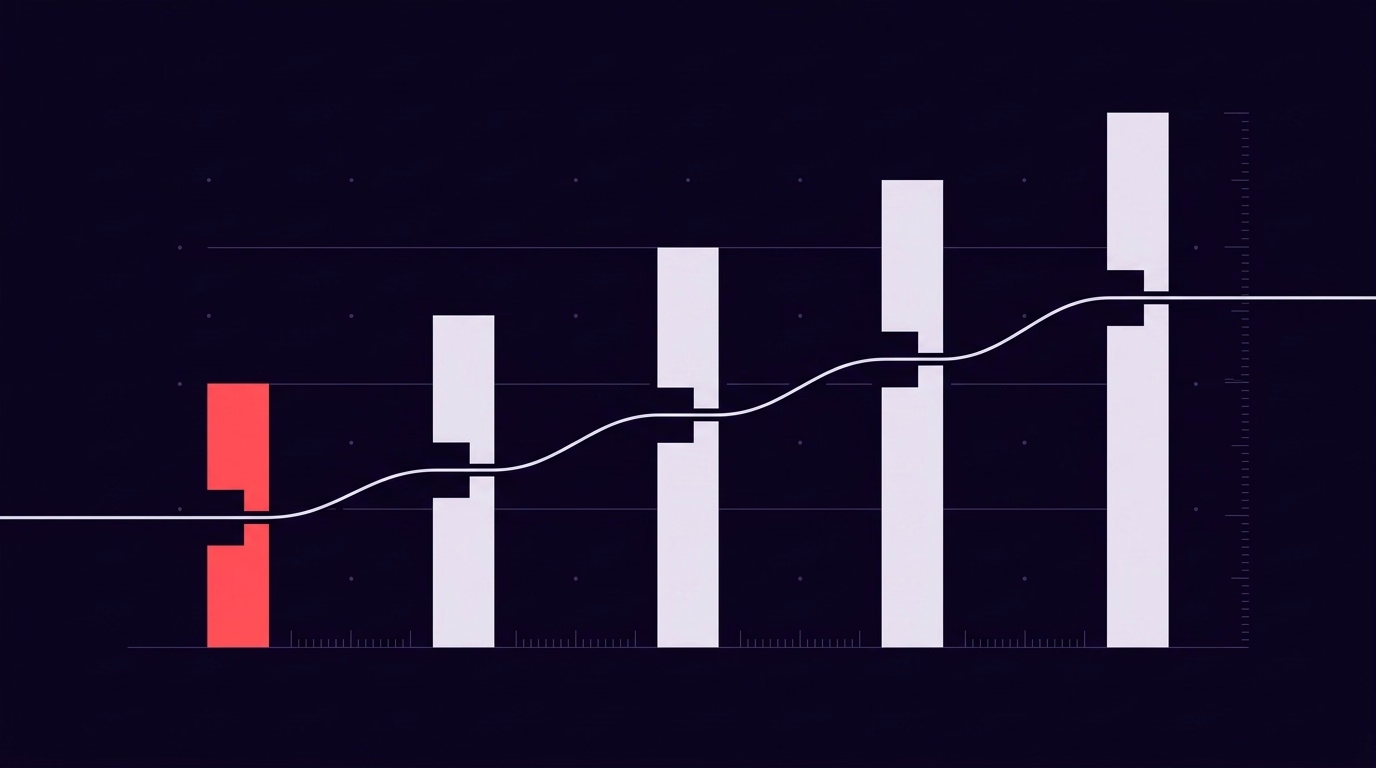
The same prompts, the same engines, the same conditions, a month later. This is the primary measure and the only one that is genuinely yours. Moving from 14 appearances to 19 is a result. Scoring 19 with nothing to compare it to is a reading.
Watch the shape as well as the total. Appearances rising while the number of distinct pages cited stays at one is fragile growth: you have a single asset doing all the work, and one engine changing its mind takes the whole position with it.
2. Against the competitors in your own prompt set
This is the comparison people skip, and it is the most useful one in the report. For every prompt where you did not appear, record who did. After forty prompts you have a ranked list of who the engines currently treat as the authority in your category, built from your own data rather than from a vendor’s panel.
That list tends to be uncomfortable and clarifying in equal measure. It is common to find that the firms named most often are not your commercial rivals at all but directories, comparison sites and trade publications. That is a different problem from losing to a competitor, and it needs a different response, usually earned mentions rather than more pages. We looked at that pattern in brand citations.
3. Against whether the category is asked about at all
Before concluding that a low score is a failure, establish whether the answers exist to be won. If a prompt returns a generic explanation with no brands named by anyone, nobody is winning it and your absence is not a defeat. Count those separately as unclaimed prompts.
Unclaimed prompts are the most valuable column in the whole exercise, because they are the openings. A category where engines are not yet naming anyone is a category where being the first clear, citable source is still cheap. One good page can take a prompt nobody owns. Six months later, once three competitors have published against it, the same position costs a campaign.
How to read a low score
A low score has four possible causes. They look identical in the figure. Separating them is the actual work.
- You are not readable. AI user agents cannot reach or parse the pages that answer the question. Nothing else matters until this is fixed. See what AI actually reads on your website.
- You are readable but not extractable. The answer is on the page, buried in a narrative paragraph with no clear claim an engine can lift. This is the most common cause among firms with good content.
- Your entity is ambiguous. The engine is not confident who you are, so it declines to name you. Branded prompts are the test: if you do not appear for your own name, this is your problem. See entity-driven SEO.
- You are being outranked as a source. Everything works and a competitor is simply more authoritative on that question. This is the only one of the four that is a content and authority problem rather than a defect.
Most firms assume the fourth and have one of the first three. The first three are also considerably cheaper to fix, which is the good news buried in a bad number.
How to read a high score
High scores carry their own traps, and complacency is expensive.
Check the prompt set is hard. A score of 70% against prompts containing your own brand name is not visibility, it is a mirror. Strip the branded prompts out and look at the unbranded number separately. It is usually a fraction of the headline.
Check what is being said. Presence is not endorsement. Appearing in nineteen answers as the firm that is thorough but slow is a high score and a reputational finding. Read the verbatim text.
Check the concentration. If one page is carrying most of the mentions, the position is narrower than it looks. Breadth of cited sources is the measure of durability.
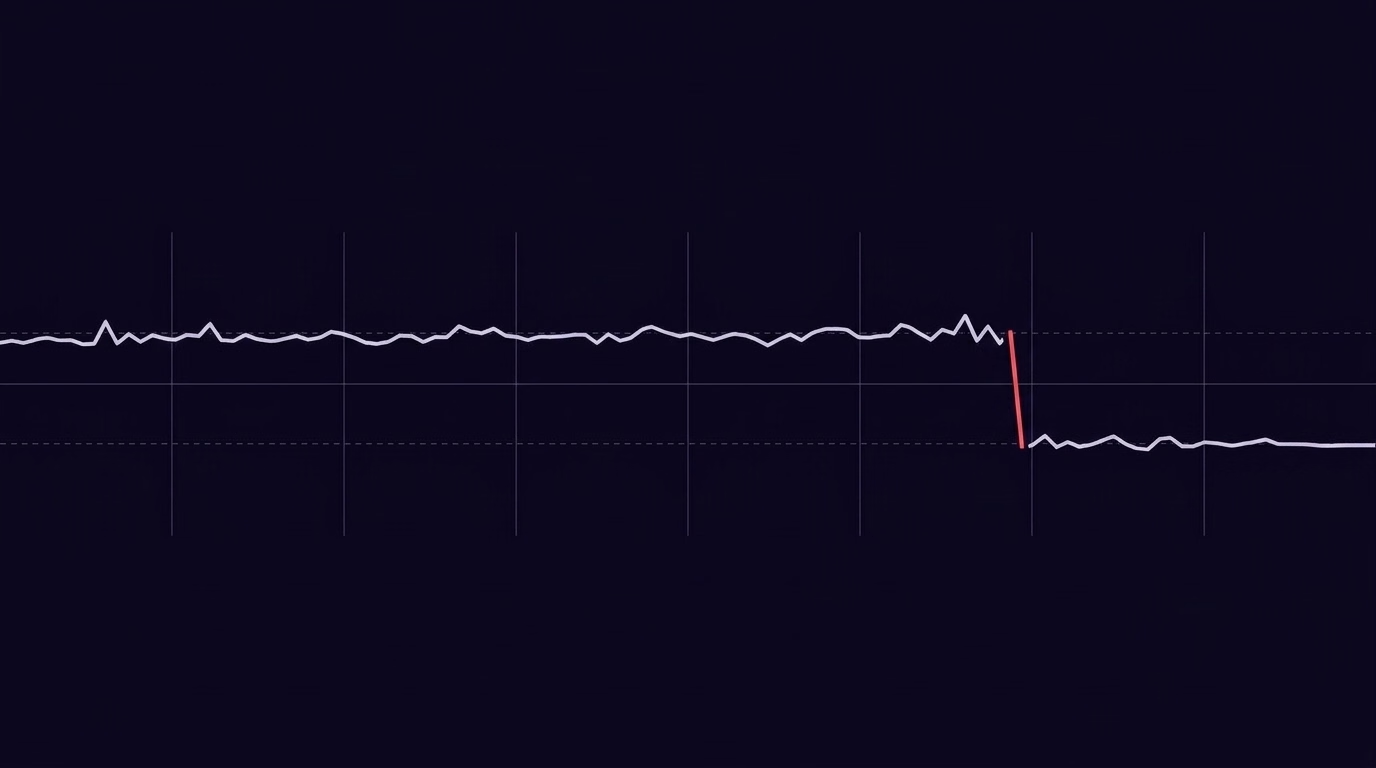
Check it is converting. This is the one that matters commercially and the one most reports never reach. Appearances are not enquiries. A mention without a link sends nobody anywhere, and even a linked citation competes with the engine’s own summary, which has usually already answered the question. So a score that doubles while enquiry volume stays flat is a measurement success and a commercial non-event, and it is worth saying so out loud before anyone builds a budget on it. Track appearances and enquiries side by side from the first baseline, or you will not be able to tell which is which a year from now.
Setting a target you can defend
If you need a figure to put in a plan, build it from your own data rather than borrowing one. A defensible target has this shape:
Over the next two quarters, increase unbranded appearances from 11 of 48 to 20 of 48, with cited sources rising from 5 distinct pages to at least 12, and at least one appearance established on Gemini, where we currently have none. Measured monthly on the frozen prompt set of 14 October.
Note what that target does. It excludes branded prompts, so it cannot be gamed. It names the engine where you are weakest. It treats breadth of sources as a separate goal from volume of appearances. And it states the instrument and the date, so in six months it is still auditable.
Compare that with “improve our AI visibility score to 40%”. The second is easier to put on a slide and impossible to hold anyone to.
FAQ
What is a good AI visibility score?
There is no universal threshold. A score is appearances divided by prompts run, so it depends entirely on which prompts were asked, on which engines and how many times. The only meaningful tests are whether the number is higher than your own previous measurement on the same frozen prompt set, whether it is higher than the competitors appearing in that same set, and whether the prompts you are absent from are actually being claimed by anyone. Published sector averages should be treated with caution because they have no shared denominator.
Are AI visibility benchmarks by industry reliable?
Mostly not. Three problems undermine them: every provider measures against a different prompt set and engine mix, so there is no common base to average; broad sector labels group firms whose buyers search in completely different ways; and engine behaviour is changing fast enough that a benchmark gathered six months ago describes a different environment. A benchmark you build from your own prompt set, including your real competitors, takes about a day and is the only one that holds up.
Is a zero AI visibility score on one engine a problem?
Not necessarily, and it is common. First check whether anyone is being named in that engine’s answers to your prompts. If the responses are generic explanations with no brands cited, nobody is winning those prompts and your absence is not a defeat, it is an unclaimed opening. If competitors are consistently named and you are not, that is a genuine gap, and the cause is usually crawlability, extractable structure or entity ambiguity before it is content quality.
Want a benchmark built from your own category?
Our SEO Intelligence Report benchmarks you against your actual competitors, not a sector average: mention rate per engine across ChatGPT, Perplexity and Gemini, the share of answers naming you versus each rival, which of them the engines recommend when you are absent, and an AI SWOT built from what the engines actually say.

Related
Articles